ESSA
See instructions at the end to view report in a different language.
For additional reports please visit ESSA
For additional information regarding the report card, please visit the Wyoming Measures Up website.
Once you are on the website, please follow these directions to locate the information for our school district.
For the Wyoming Report Card, click on view state report
For our District Report Card, choose Carbon #1 from the district dropdown, and then click view district
For a School Report Card, first choose Carbon #1 from the district dropdown, and then select the school of your choice from the dropdown menu

Overview
School and District Contact Information
Rawlins Elementary School
Web Address
Principal: Benita Allard
Address: 1301 Darnley Rd, Rawlins, WY 82301
Email Benita Allard
Phone: (307)328-7900
Carbon County School District
Web Address
Superintendent: Mike Hamel
Address: 615 Rodeo St, Rawlins, WY 82301
Email Mike Hamel
Phone: (307)328-9200
At a Glance
Category | Rawlins Elementary School | Carbon County School District 1 | Wyoming |
|---|---|---|---|
Total Enrollment | 658 | 1,668 | 91,992 |
Teachers | 66 | 153 | 7,366 |
English Learner Students Gaining Language Proficiency | 5-10% | 4-6% | 10% |
Proficient in Math | 45% | 43% | 48% |
Proficient in English Language Arts | 38% | 51% | 53% |
Cost of Education (Dollars Spent Per Student) | $19,313 | $-- | $-- |
Enrollment Breakdown
Rawlins Elementary School Enrollment by Gender
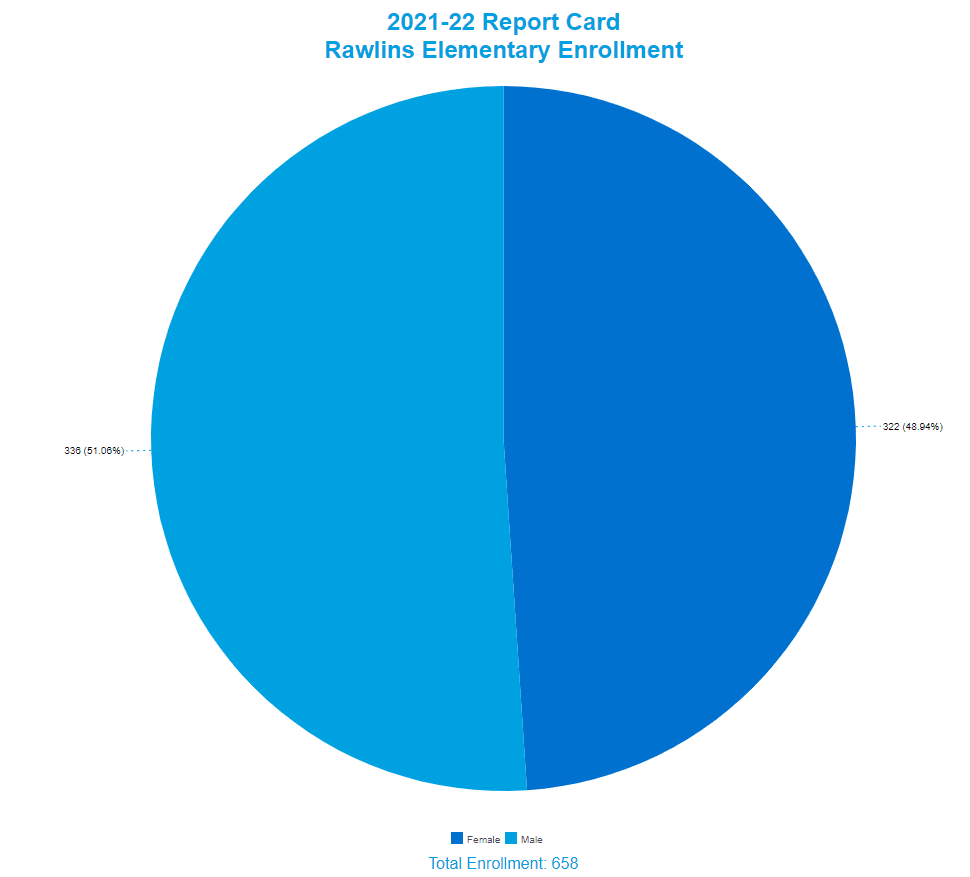
Female: 322 (48.94%)
Male: 336 (51.06%)
Rawlins Elementary School Enrollment by Race/Ethnicity
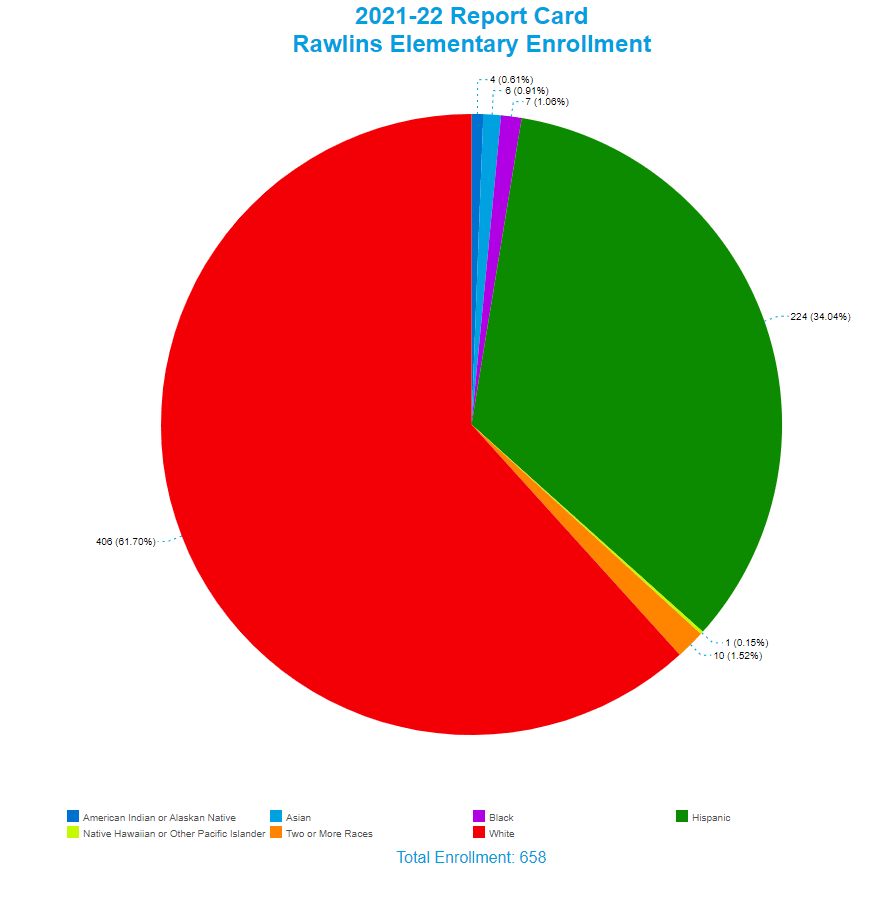
White- 406 (61.70%)
Hispanic- 224 (34.04%)
Black- 7 (1.06%)
Asian- 6 (0.91%)
Native Hawaiian or Other Pacific Islander 1 (0.15%)
American Indian or Alaskan Native- 4 (0.61%)
Two or More Races- 10 (1.52%)
Rawlins Elementary School Enrollment by Income Status
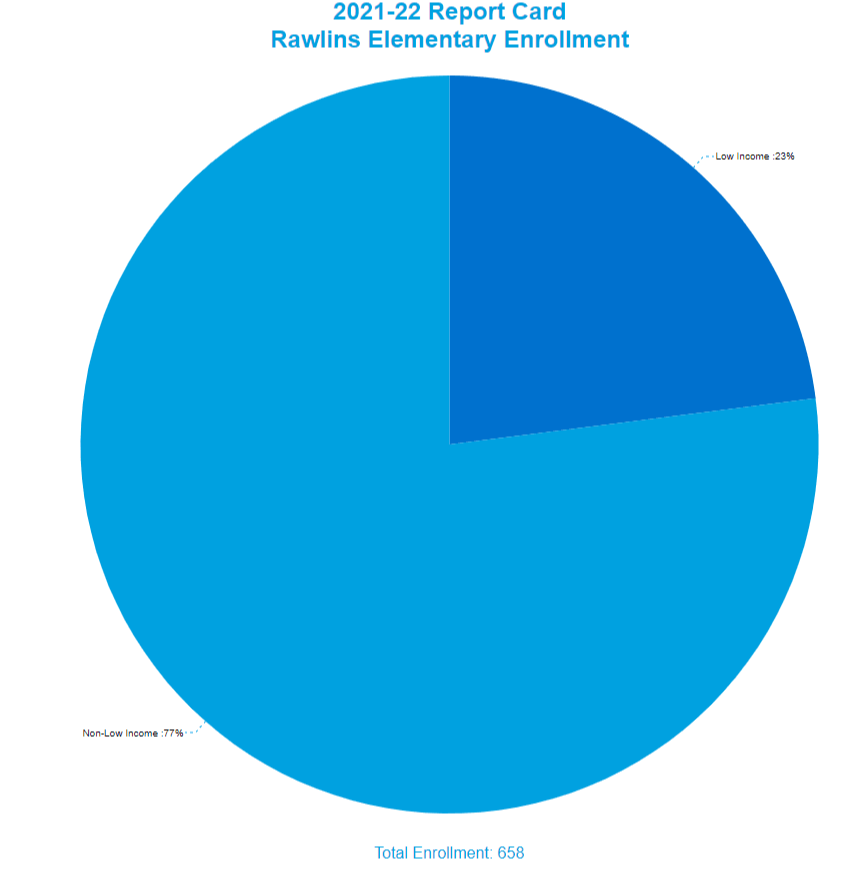
Low Income- 23%
Non-Low Income- 77%
Rawlins Elementary School Enrollment by Disability Status
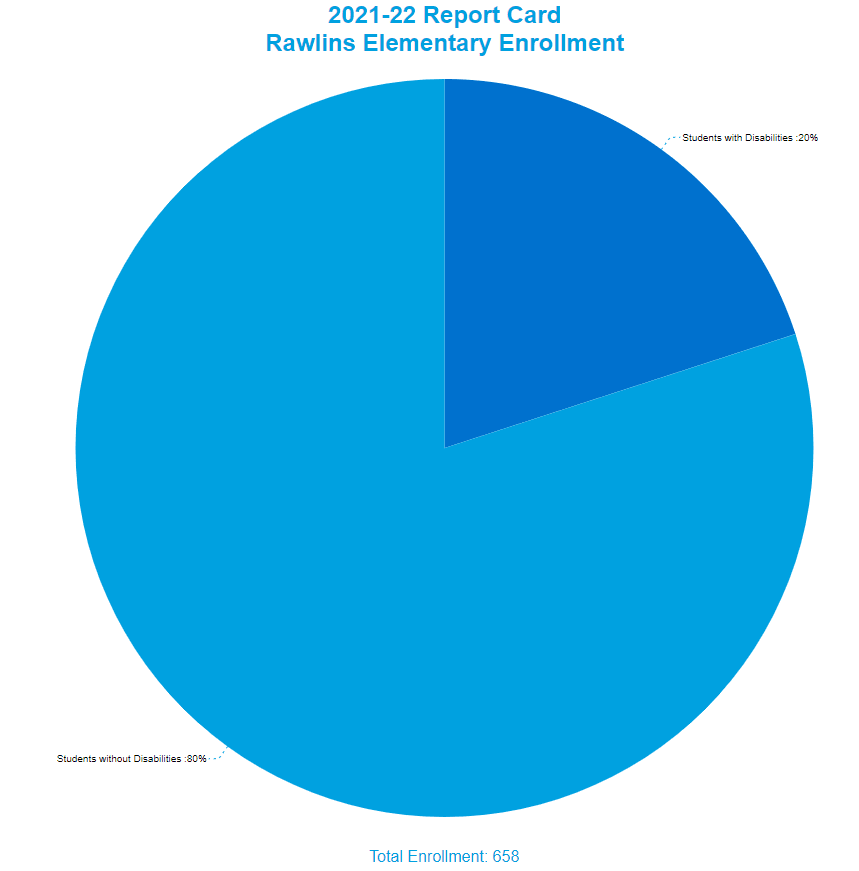
Students with Disabilities- 20%
Students without Disabilities- 80%
Rawlins Elementary School Enrollment by English Learner Status
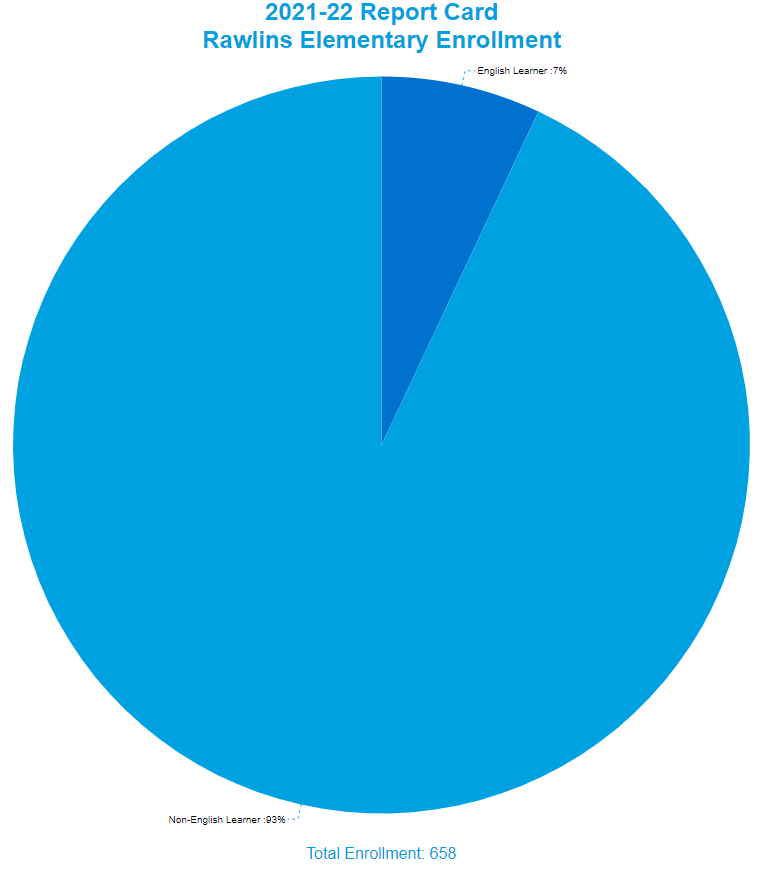
English Learner- 7%
Non-English Learner- 93%
Rawlins Elementary School Enrollment by Homeless Status
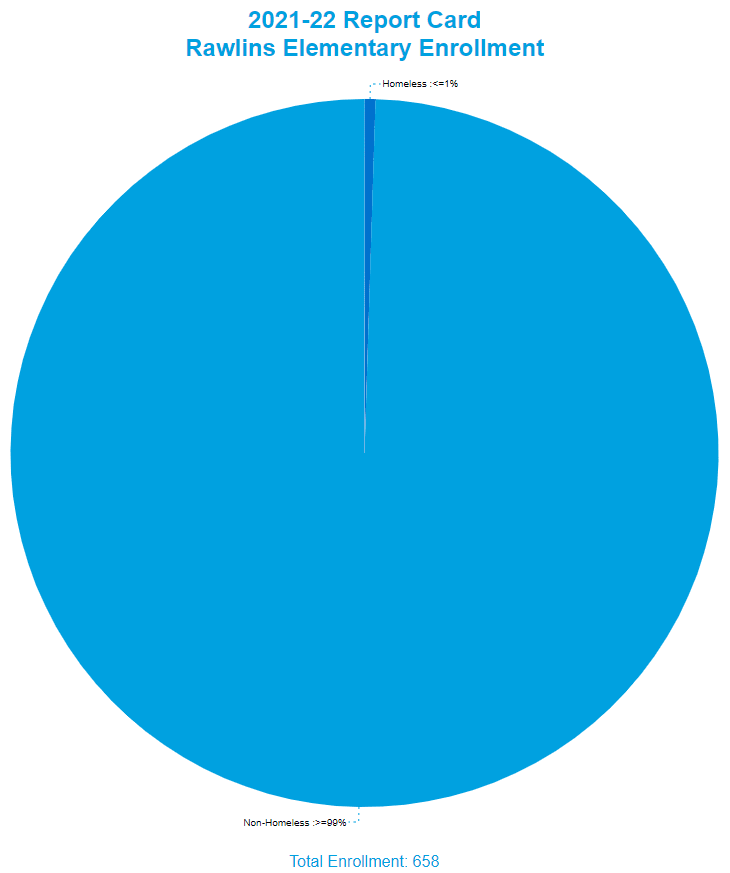
Homeless <=1%
Non-Homeless >=99%
Rawlins Elementary School Enrollment by Foster Care Status
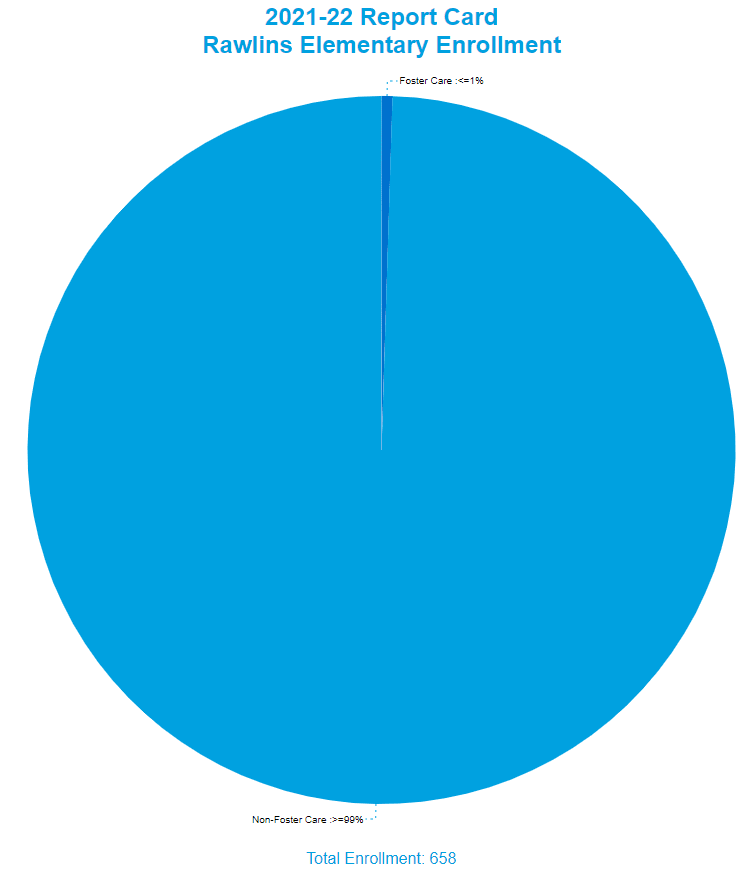
Foster Care <=1%
Non-Foster Care >=99%
Teacher Qualification at Rawlins Elementary School
Category | FTE | Percent |
|---|---|---|
Rawlins Elementary School Teachers | 64.87 | 100% |
Inexperienced Teachers | 20.87 | 32.17% |
Emergency/Provisional Credential Teachers | 3.40 | 5.24% |
Out of Field Teachers | 0.00 | 0% |
Inexperienced teacher: Any teacher with less than three years teaching experience in Wyoming and other states.
Emergency/Provisional Credentialed Teachers: A teacher with an exception authorization allowing them to teach in an area other than that for which they hold a standard license and endorsement.
Out-of-field teacher: A teacher who has an educator license, but who does not have an educator license or an endorsement in the field they are currently teaching; an out-of-field teacher is designated as an unqualified teacher.
FTE = Full Time Equivalent, e.g., a half-time position is 0.5 FTE
Wyoming Public School Assessment Results
N/R(Not Reportable) – Assessment outcomes are not reported for less than 10 students.N/A(Not Available) - USED granted a waiver for the cancellation of the state assessment and federalaccountability for the 2019-2020 academic year due to the COVID pandemic.
English Language Arts Proficiency
(Grades 3 to 10 Participation Rate: >=99%)
(Grades 3 to 5)
Rawlins Elementary: 38%
Carbon #1: 42%
Wyoming: 51%
Math Proficiency
(Grades 3 to 10 Participation Rate: >=99%)
Elementary and Middle School (Grades 3 to 5)
Rawlins Elementary: 45%
Carbon #1: 49%
Wyoming: 52%
English Learners Enrolled During Testing
41 to 50
Percent English Proficient
5-10%
Alternate Assessment Participation
Subject | Grade | # of Students | % of Students |
|---|---|---|---|
Math | 3 | 0 to 9 | <=2% |
Math | 4 | 0 to 9 | <=2% |
Math | 5 | 0 to 9 | <=2% |
Language Arts | 3 | 0 to 9 | <=2% |
Language Arts | 4 | 0 to 9 | <=2% |
Language Arts | 5 | 0 to 9 | <=2% |
Science | 4 | 0 to 9 | <=2% |
The Alternate Assessment is for students with the most significant cognitive disabilities. Federal law limits the number of students that take an alternate assessment to no more than 1% of all students in each grade that is assessed (Every Student Succeeds Act Sec. 1111(b)(2)(D)(i)(I)).
Long-Term School Goals and Interim Targets for Student Groups Proficient or Advanced on WY-TOPP English/Language Arts
Student Group | 15-Year Goal | At or Above Goal* | Current Year Interim Target At or Above IT* |
|---|---|---|---|
All | 59% | No | No |
Black | 57% | - | - |
EL | 43% | No | No |
Free/Reduced Lunch | 55% | No | No |
Hispanic | 54% | No | No |
IEP | 37% | No | No |
Native American | 37% | - | - |
Two or More Races | 62% | No | No |
White | 62% | No | No |
Long-Term School Goals and Interim Targets for Student Groups Proficient or Advanced on WY-TOPP Math
Student Group | 15-Year Goal | At or Above Goal* | Current Year Interim Target At or Above IT* |
|---|---|---|---|
All | 57% | No | No |
Black | 46% | - | - |
EL | 43% | Yes | Yes |
Free/Reduced Lunch | 53% | No | No |
Hispanic | 53% | No | Yes |
IEP | 35% | No | No |
Native American | 34% | - | - |
Two or More Races | 65% | No | No |
White | 61% | No | No |
Long-Term School Goals and Interim Targets for Student Groups Proficient or Advanced for English Learner Progress
Student Group | 15-Year Goal | At or Above Goal* | Current Year Interim Target At or Above IT* |
|---|---|---|---|
All | 53% | No | Yes |
School Climate
Staffing and Finance
Staffing Characteristics | School | District |
|---|---|---|
Total Teachers (FTE) | 67.0 | 147.0 |
Total Counselors (FTE) | 1.0 | 5.0 |
Teachers Meeting all State Licensing and Certification Requirements (FTE) | 100.0% | 100.0% |
Teachers in 1st Year of Teaching (FTE) | 7.5% | 7.5% |
Teachers in 2nd Year of Teaching (FTE) | 11.9% | 10.9% |
Teachers Absent > 10 Days of the School Year (FTE) | 12.0 | 34.0 |
Students to Teachers (FTE) Ratio | 11.19 : 1 | 11.88 : 1 |
School Expenditures | School Amount | Amount Per Pupil |
|---|---|---|
Personnel Salary Expenditures - Teachers | $2,759,181.58 | $3,678.91 |
Personnel Salary Expenditures - Instructional Aides | $151,603.89 | $202.14 |
Non-Personnel Expenditures | $718,002.21 | $957.34 |
Chronic Absenteeism
Student Group | Percentage of Enrollment | Chronically Absent |
|---|---|---|
All Students | 100% | 0.0% |
American Indian or Alaskan Native | 2.4% | 0.0% |
Asian | 2.0% | 0.0% |
Black or African American | 2.7% | 0.0% |
Hispanic or Latino of any race | 36.5% | 0.0% |
Native Hawaiian or Other Pacific Islander | 0.1% | 0.0% |
Two or more races | 0.1% | 0.0% |
White | 56.1% | 0.0% |
Limited English Proficiency (LEP) | 9.7% | 0.0% |
Disability (IDEA + Section 504) | 17.2% | 0.0% |
Discipline, Restraints/Seclusion, Harassment/Bullying
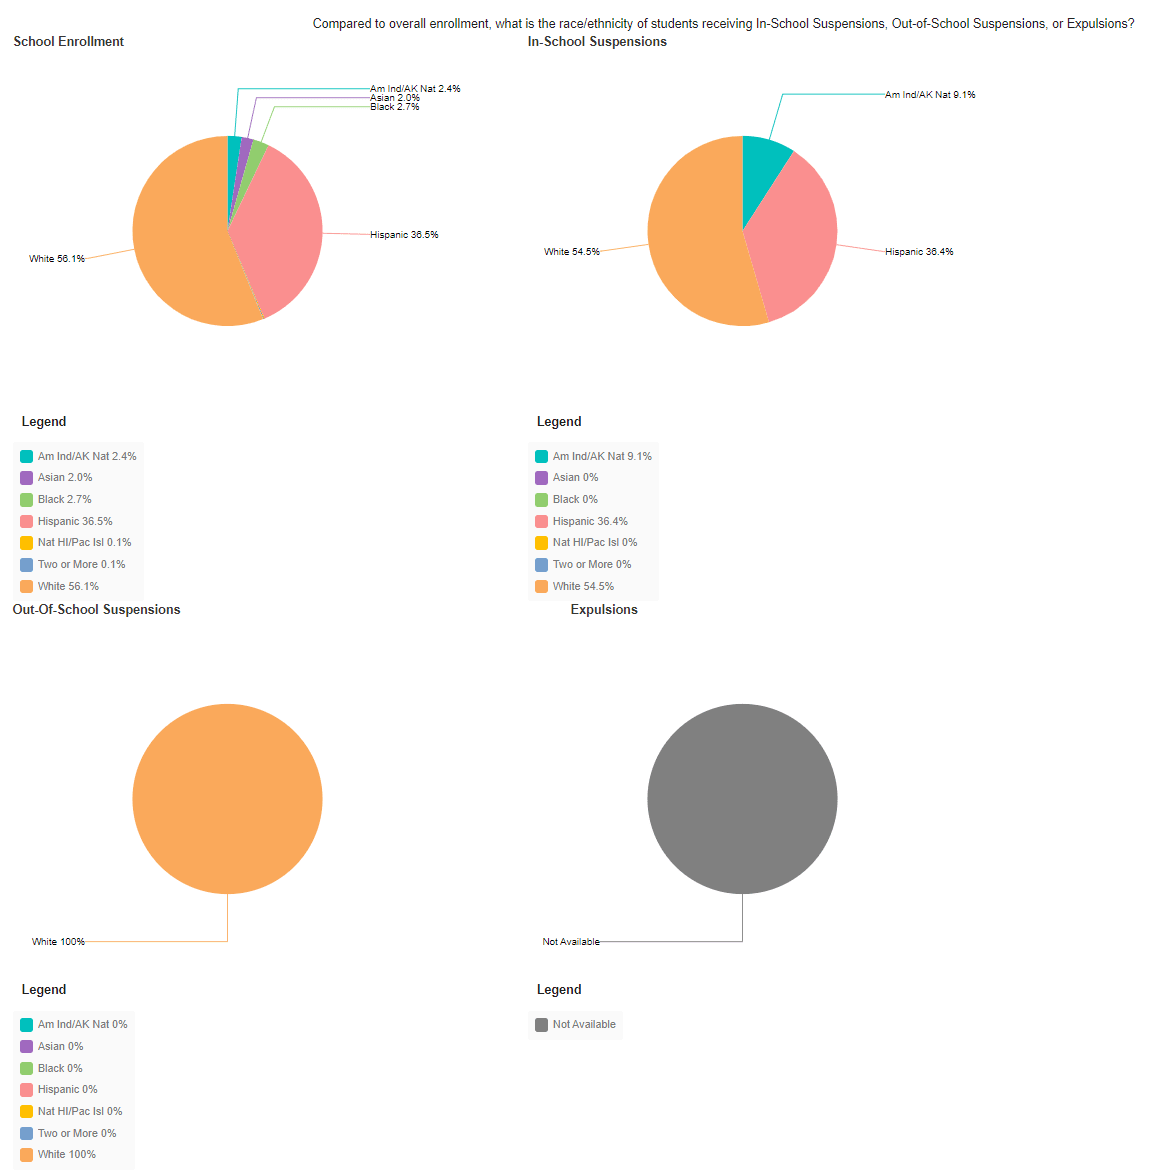
* Section 504 Only discipline data is not available by race/ethnicity.
Number of Section 504 Only students disciplined: In-School Suspensions=0, Out of School Suspensions=0, Expulsions=0
Removal by Race/Ethnicity
Student Group | School Enrollment | In-School Suspension | Out-of-School Suspensions |
|---|---|---|---|
American Indian and Alaskan Native | 2.4% | 9.1% | 0.0% |
Asian | 2.0% | 0.0% | 0.0% |
Black | 2.7% | 0.0% | 0.0% |
Hispanic | 36.5% | 36.4% | 0.0% |
Native Hawaiian or Other Pacific Islander | 0.1% | 0.0% | 0.0% |
White | 56.1% | 54.5% | 100% |
Two or More | 0.1% | 0.0% | 0.0% |
Total Number of Students Referred to Law Enforcement | 0 |
Total Number of Students with School-Related Arrests | 0 |
Total Number of Students Expelled under Zero-Tolerance Policies | 0 |
Total Number of Students Who Received Corporal Punishment | 0 |
Does this school have sworn law enforcement officers? | No |
Civil Rights Data Collection (CRDC)
Since 1968, the U.S. Department of Education (ED) has conducted the Civil Rights Data Collection (CRDC) to collect data on key education and civil rights issues in our nation's public schools. The CRDC is collected every two years and gathers a variety of information including: enrollment demographics, preschool, math and science courses, advanced placement, ACT & SAT, discipline, school expenditures and teacher experience. The CRDC is a longstanding and important aspect of the ED Office for Civil Rights (OCR) overall strategy for administering and enforcing the civil rights statutes for which it is responsible. Below are the instructions for accessing the most recent state-level CRDC reports on the Office for Civil Rights website.
School Reports on OCR Site:
ocrdata.ed.gov
Select 'School and District Search'
On the Find School(s) Tab, Type in the School Name (Rawlins Elementary)
Select the Year (2015)
Select the State (Wyoming)
Select School Search link
To access the report click on the school name (Rawlins Elementary) .
Obtaining Alternative Copies
To view this report online visit:
District- ESSA
Rawlins Elementary School- res.crb1.net/ESSA
Rawlins Middle School- res.crb1.net/ESSA
Rawlins High School- rhs.crb1.net/ESSA
Rawlins Cooperative High School- rchs.crb1.net/ESSA
Little Snake River Valley School- lsrv.crb1.net/ESSA
To obtain a physical copy of this report please visit Carbon County School District #1 Main Office 615 Rodeo St, Rawlins, WY 82301
